


Chai Shots is a series on all things that should be changing in South Asian Health.

We Must Start Younger
In my two year effort to understand and build a framework for the metabolic syndrome in South Asians, a consistent picture has emerged of a phenotype that we’re misinterpreting because of metrics that aren’t properly adjusted for South Asians, resulting in interventions that may be misdirected, insufficient, or late.
This has been most clear for the SA in the Western world, for two reasons: we are using Western guidelines that are more directly adjusted for other ethnic groups, and there are additional barriers to implementing change such as insurance reimbursement.
This week, however, I was thrilled to stumble on four new studies–two from South Asia, and two from SA populations in the US and UK–that reinforce this narrative, but also raise the bar in some really interesting ways.
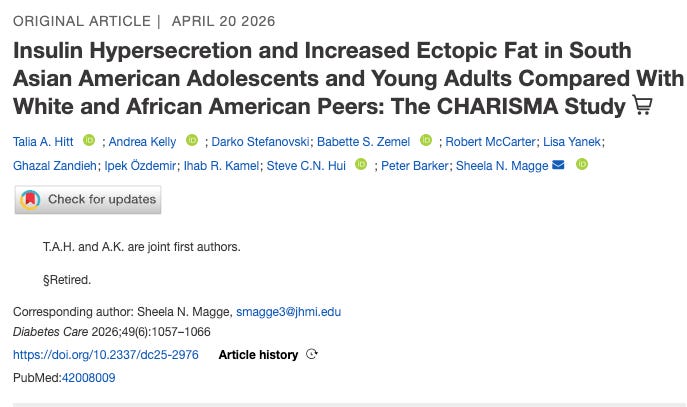
First, a study by Hitt et al. (Hitt et al., Diabetes Care)–CHARISMA–that looked at liver fat, insulin resistance, and β cell function in South Asian, African American, and White children and adolescents in the US.
There were 155 subjects (53 SA, 53 W, 49 AA) between the ages of 12-21, and matched for age, pubertal status, gender, and BMI percentile.
Keep in mind that this does NOT mean lean: ideal BMI is 20-23, and although inclusion started at a BMI of 23 or the 80th percentile of BMI for age, median BMI for the SA kids was 27.7. All SA were defined as having ≥3 SA grandparents and to have lived in the US before 10yrs.
There are several important points from the study:
SA children have dramatically higher rates of ectopic fat: liver fat measured by MRS* in this cohort was 4.1% (versus 1.3% for AA and 1.2% for W subjects–so SA livers had 3.4X the fat of W subjects!) and visceral fat (by MRI) was also higher (SA 71.7 cm2 versus AA 46.6 and W 56.1), and liver fat was also higher “adjusted for visceral fat”.
It’s unclear how much of this is a result of the move west–but these kids had already been in the US since before 10 yrs of age. A recent study by Ghosh, Misra, and colleagues (Diabetologia) paints a similar picture in adults in New Delhi at AIIMS.
SA children have lower insulin sensitivity (SA IS 6.03 versus W IS 10.08–essentially 40% worse).
SA children compensate by pumping out more insulin–total insulin secretion during a 3-hour OGTT (another common test that we get when we have higher glucose values) is significantly higher (SA 35,075 versus W 22,695–about 55% higher!)
But SA children also have decreased insulin clearance, and greater first-pass hepatic extraction of insulin (clearance index is 0.077 for SA versus AA 0.106 and W 0.0996 L/min/kg1.4; first pass extraction is 77.4% for SA versus 65.6% AA and 72.6% W).
This leads to greater arterial versus venous differences in insulin concentrations (i.e. the pancreas is working overtime, but the liver is grabbing more insulin than it’s peers before the rest of the body sees it). This is important for several reasons–amongst them, that common tests like HOMA-IR that are based on peripheral venous blood are missing what’s happening, because they are sampling AFTER hepatic extraction!
When they stimulated the beta cells in 44 of the cohort with an arginine-clamp study, however, there was no significant difference in maximum secretory capacity.
In laymen’s terms, SA children’s β cells are already maxed out–they may look like they are producing more insulin (compared to other ethnic groups), but they’re already at 100%, whereas others are not. The disposition index–basically how well the β cells are compensating for IR–is not significantly different amongst the three groups (P=0.61) because of this.
Despite all of these differences, there was NO difference between ethnic groups for fasting or 2-hour glucose and HOMA-IR! Only the HbA1c was significantly (though not meaningfully) different–with the SA children actually having the best values (SA 5.2, W 5.1, AA 5.3 (P=0.007))–placing these SA children the LEAST likely to have IR/diabetes. To think its at thhat early of an age.
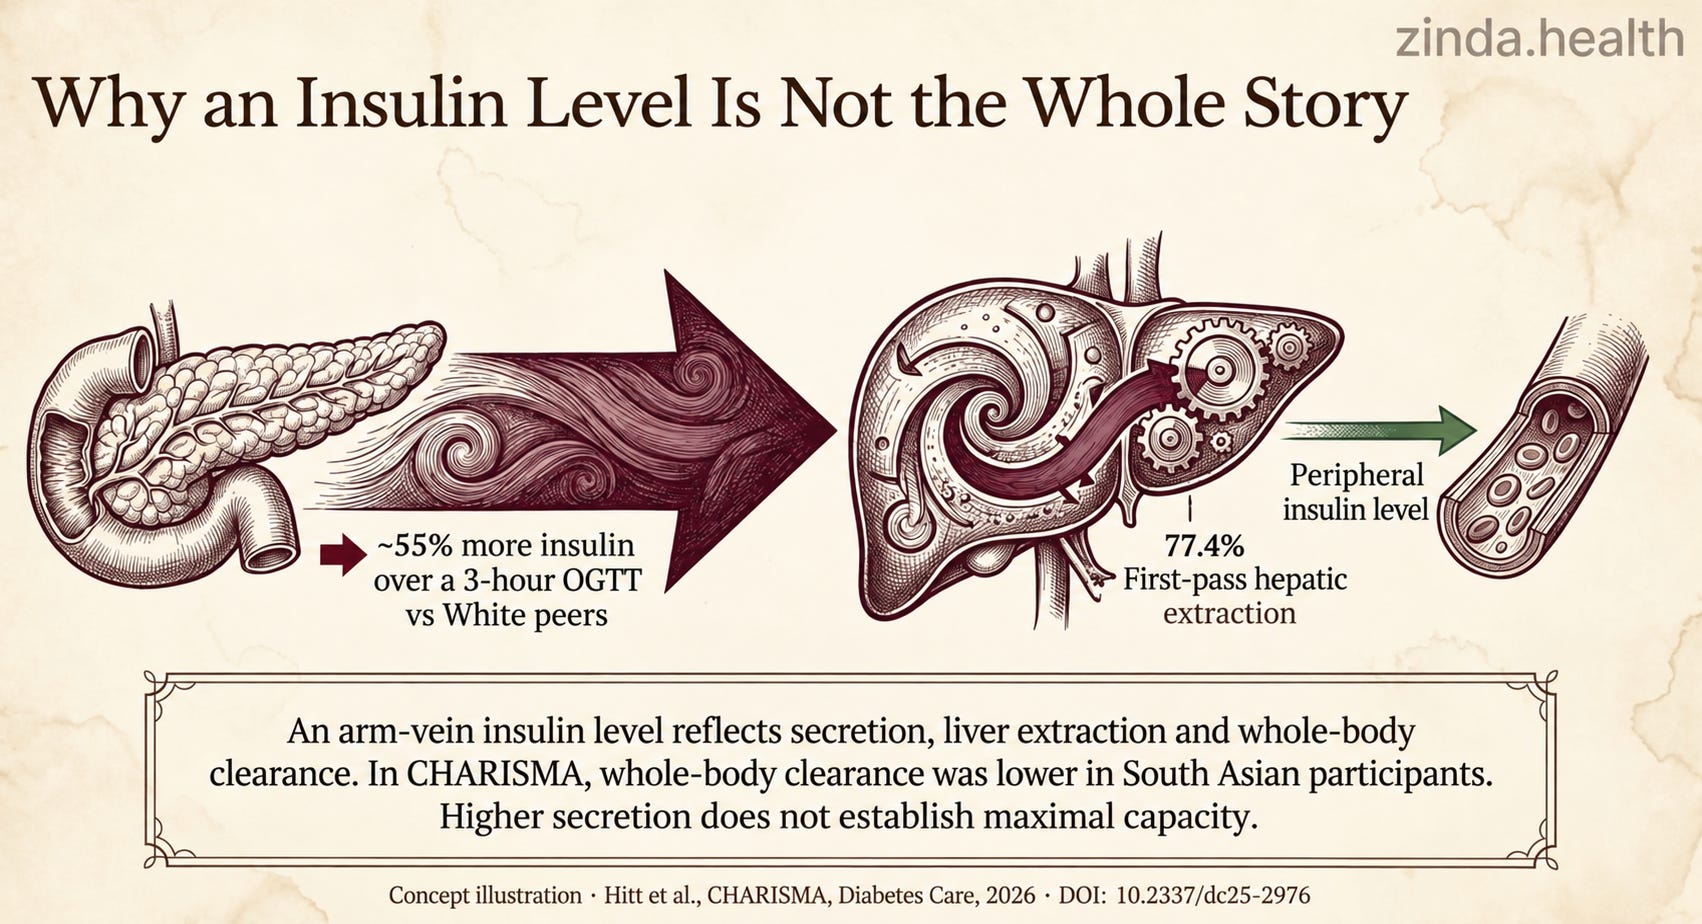
So what does that mean?
For one, it means that SA kids may look perfectly normal on most measures we take now (especially if they are fasting).
However, their bodies are already struggling to compensate and keep up, and may even already have some degree of β cell exhaustion. And we have to wait for glucose values to rise–which are the same as other ethnic groups at baseline BECAUSE these changes are allowing their bodies to keep up–to start interventions.
Their livers and viscera are already getting hammered with excess fat deposition–a key step in IR and SA that Yajnik first pointed out with the thin-fat SA phenotype–years before their HbA1cs will raise red flags.
We need to be looking harder (post prandial, rather than fasting, values; maybe liver fat screening), and acting sooner, in order to intervene appropriately and timely for our SA kids.
*Imaging modalities used in only ~30 of each group.
CHARISMA study (Hitt et al., Diabetes Care).
Three more studies to come...
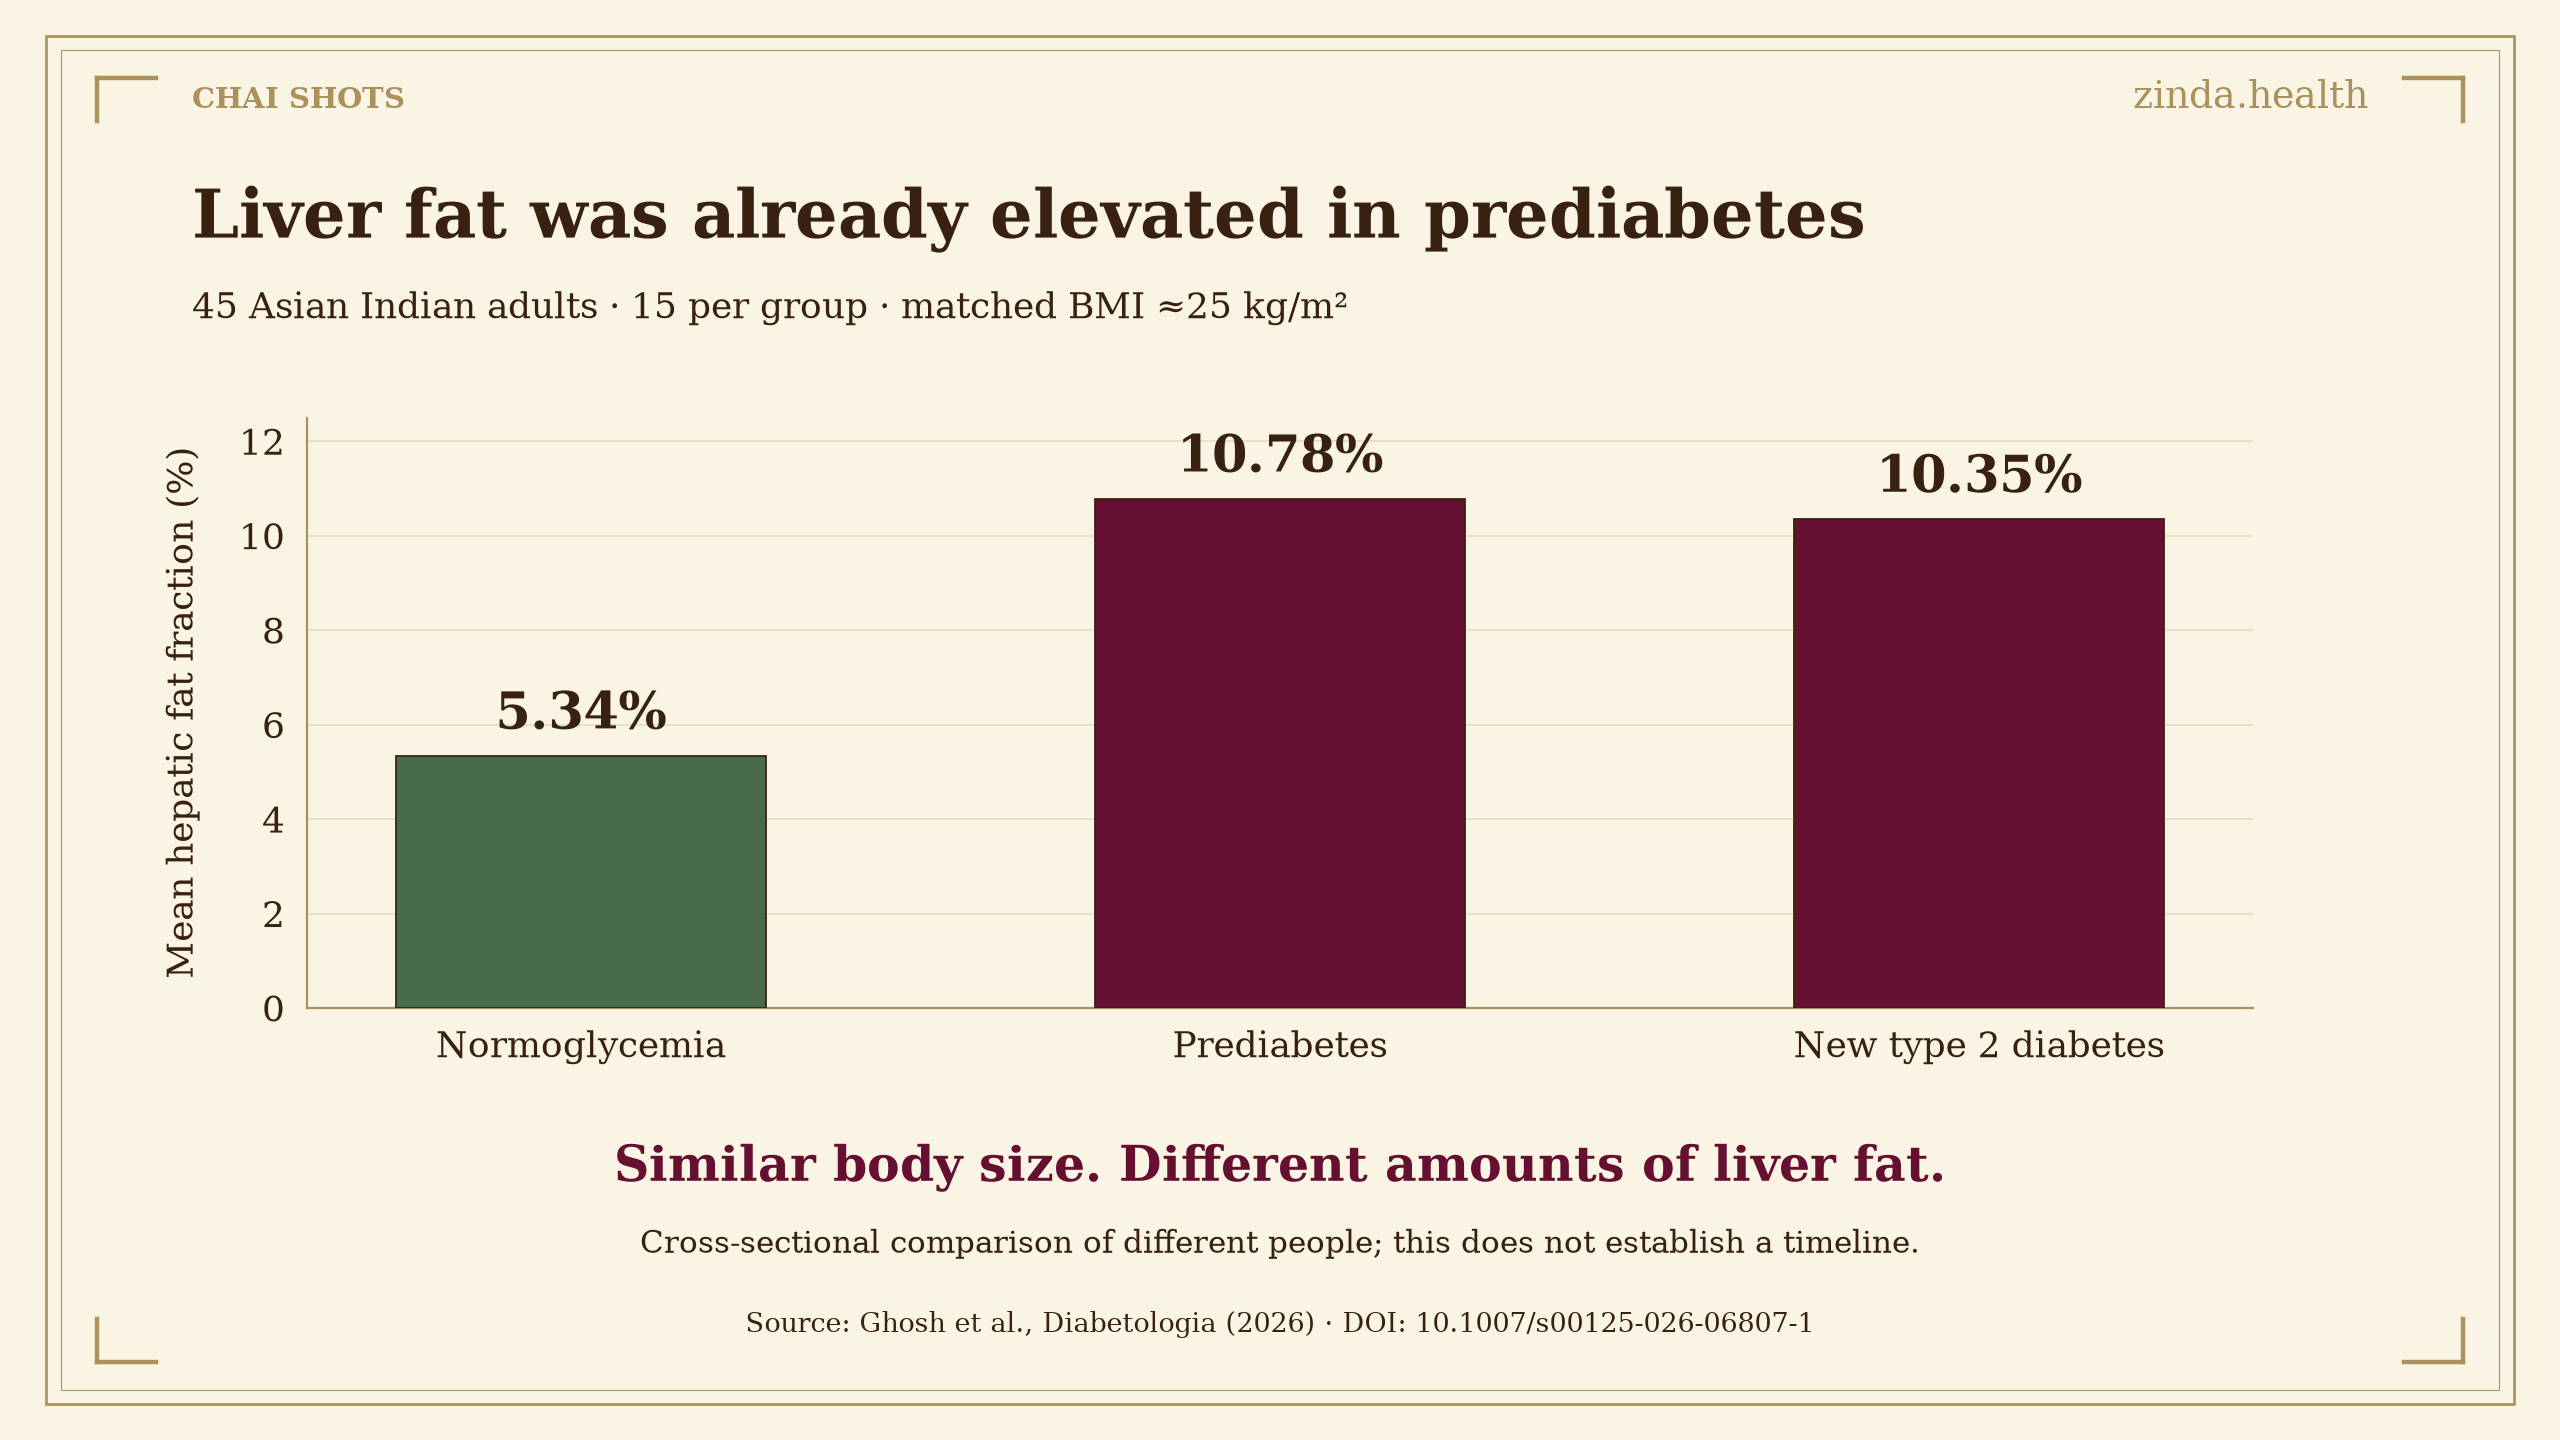
A New Delhi-based study on ectopic fat storage published earlier this year included 45 Asian Indian adults at AIIMS (n=15 in each group of normoglycemia, prediabetes and newly-diagnosed T2D), all of them matched for a BMI of ~25.
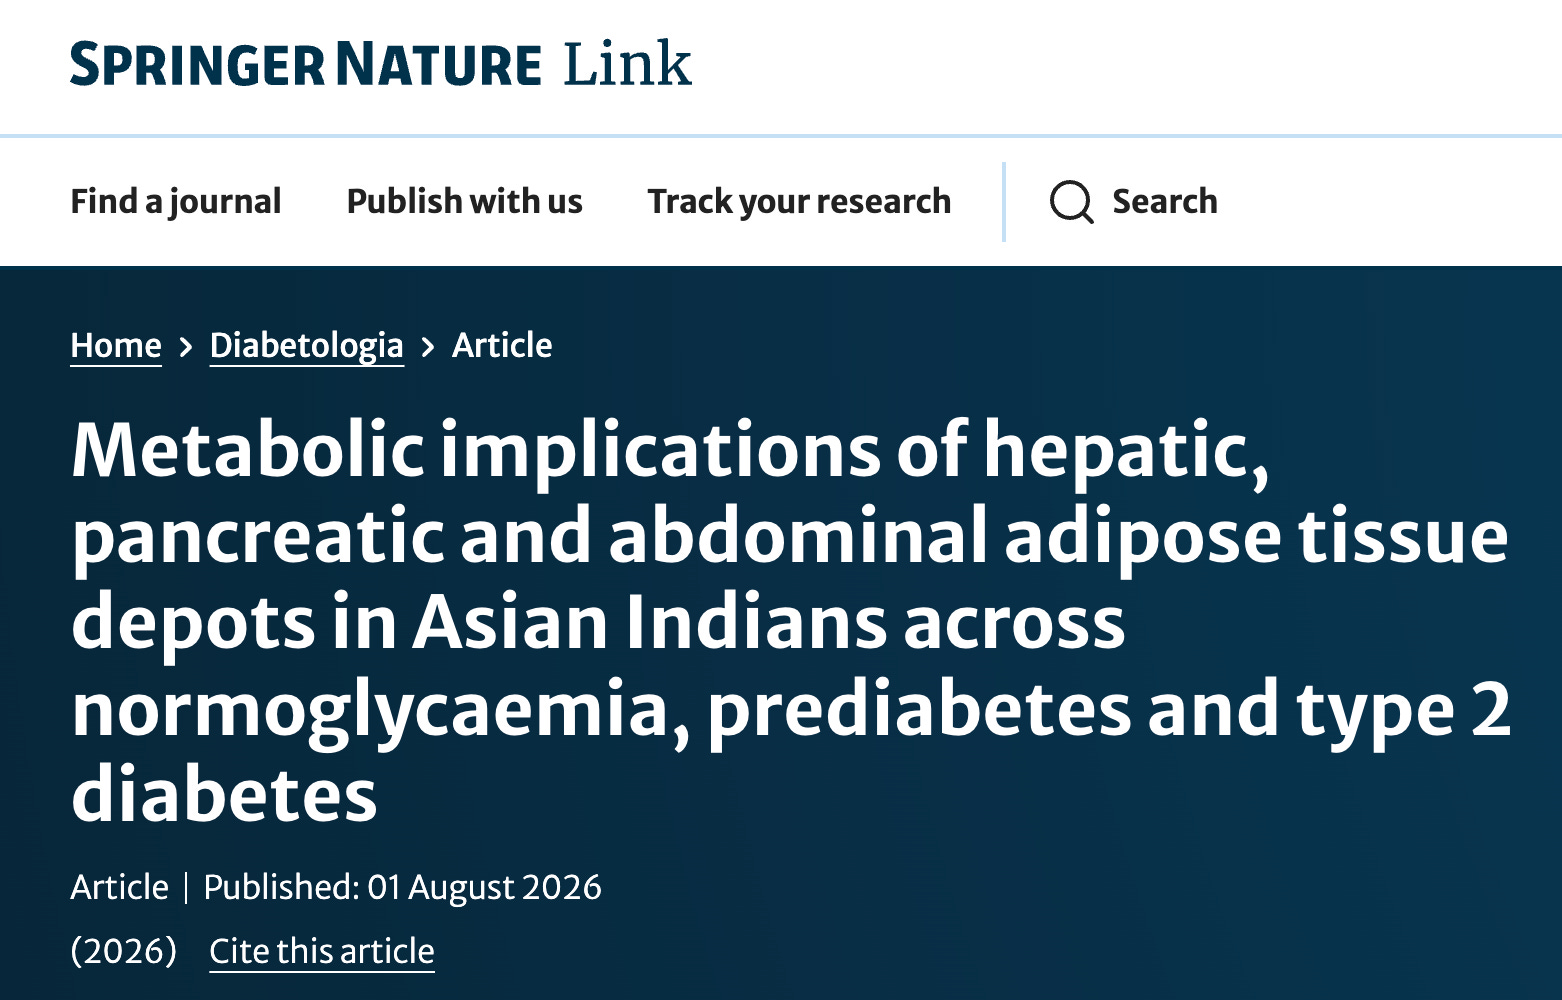
While liver and pancreatic fat was significantly higher in T2D, the increase had already happened by the prediabetic state, after which pancreatic fat decreased: liver fat was 5.34/10.78/10.35 % and pancreatic fat was 2.97/5.83/5.35 % (respectively in NGT/prediabetes/T2D).
After controlling for age and BMI, for each 1% increase in hepatic/pancreatic fat, the adjusted odds of prediabetes increased by 16%/and of any dysglycaemia by 11% (for hepatic fat). HOMA-β, which is a surrogate for β-cell compensation was significantly lower in the T2D group as compared to the other groups, so the overall story is similar to what CHARISMA shows, but a notch further along.
Interestingly, subcutaneous fat was lower in T2D than prediabetes or normoglycemia; Ghosh’s group interprets this as subQ fat being protective, so as subQ fat decreases (with aging etc.) ectopic fat deposition increases, leading to insulin resistance.
This reminds me of Yajnik’s description of the “thin” in “thin and fat”, that’s specific to Asians, it’s possible that even without Westernization of adiposity (ie an increase in overall fat), the tendency to ectopic fat deposition is genetic.
The take home message from this study is that liver and pancreatic fat increases earlier in metabolic syndrome/dysglycemia than BMI does, and can be used for risk stratification even at lower BMI levels.
(If you thought of fatty liver as an outcome of T2D, a recent meta-analysis of 18 studies conducted in India involving a total of 81,364 adults found the prevalence of fatty liver in people with T2D to be as high as 56.9%!)
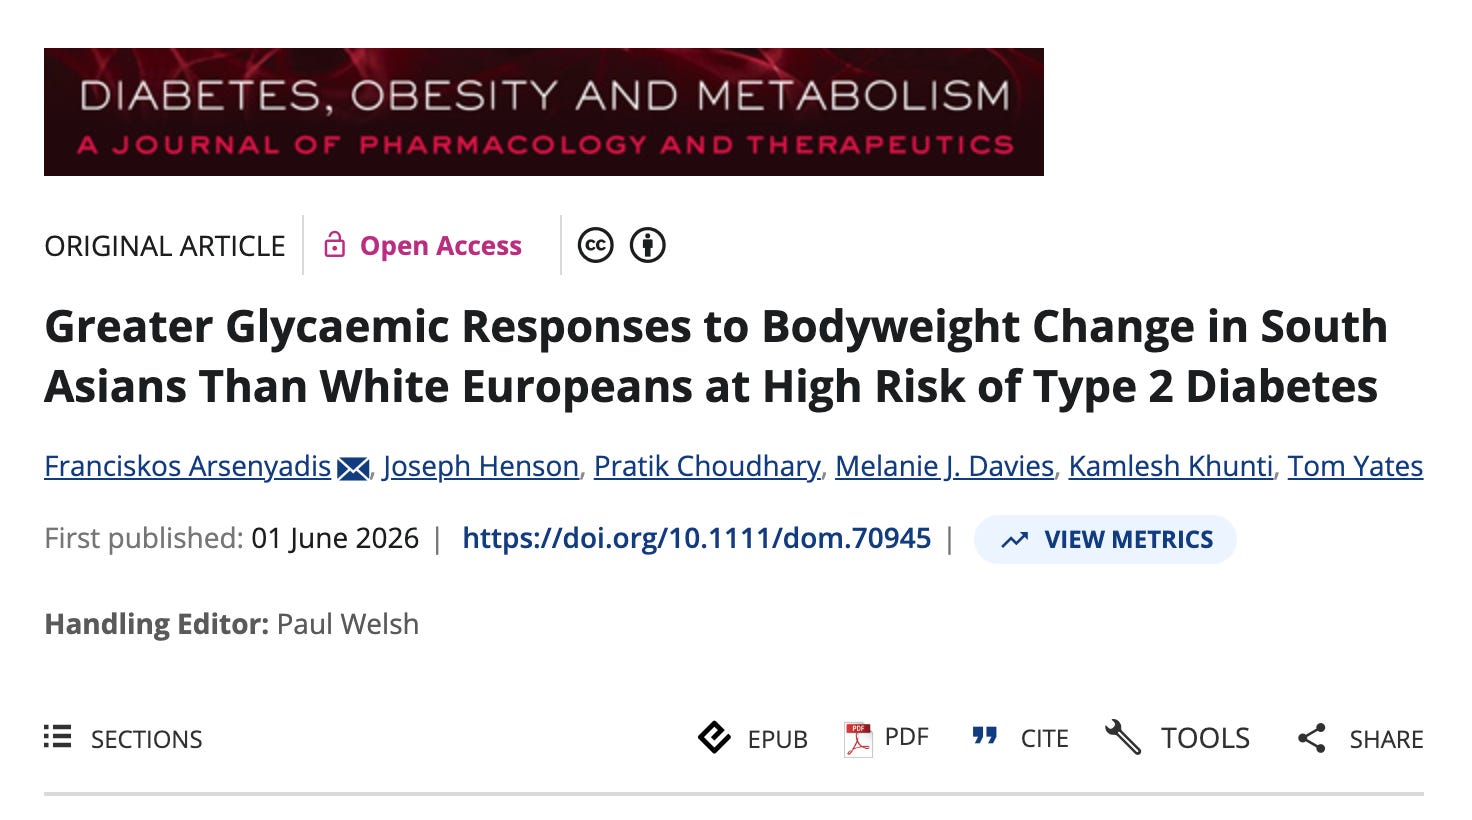
South Asians “may” be more sensitive to weight changes:
in June Arsenyadis and Yates with a Leicester-based research group published an analysis of the PROPELS trial (published in Diabetes, Obesity and Metabolism), that included 543 adults (371 WE, 172 SA) in the UK at high risk of T2D, followed for 4 years.
For each 5 kg change in body weight, HbA1c and 2h glucose decreased more in South Asians than Europeans (change per 5kg weight loss/gain): ΔHbA1c: 1.46 vs. 0.94 mmol/mol; Δ2hrPG 0.92 vs. 0.35 mmol/L, respectively).
Changes in other cardiometabolic risk markers (fasting glucose, lipids, liver enzymes and BP) were similar “adjusted for visceral fat”, across ethnicities. Interestingly, changes in fasting glucose was no different between ethnicities.
It’s post-challenge hyperglycemia that worsens with increasing weight in SA adults.
(Conveniently for us, we now have a potent new class of meds to tackle T2D, the GLP-1s!)
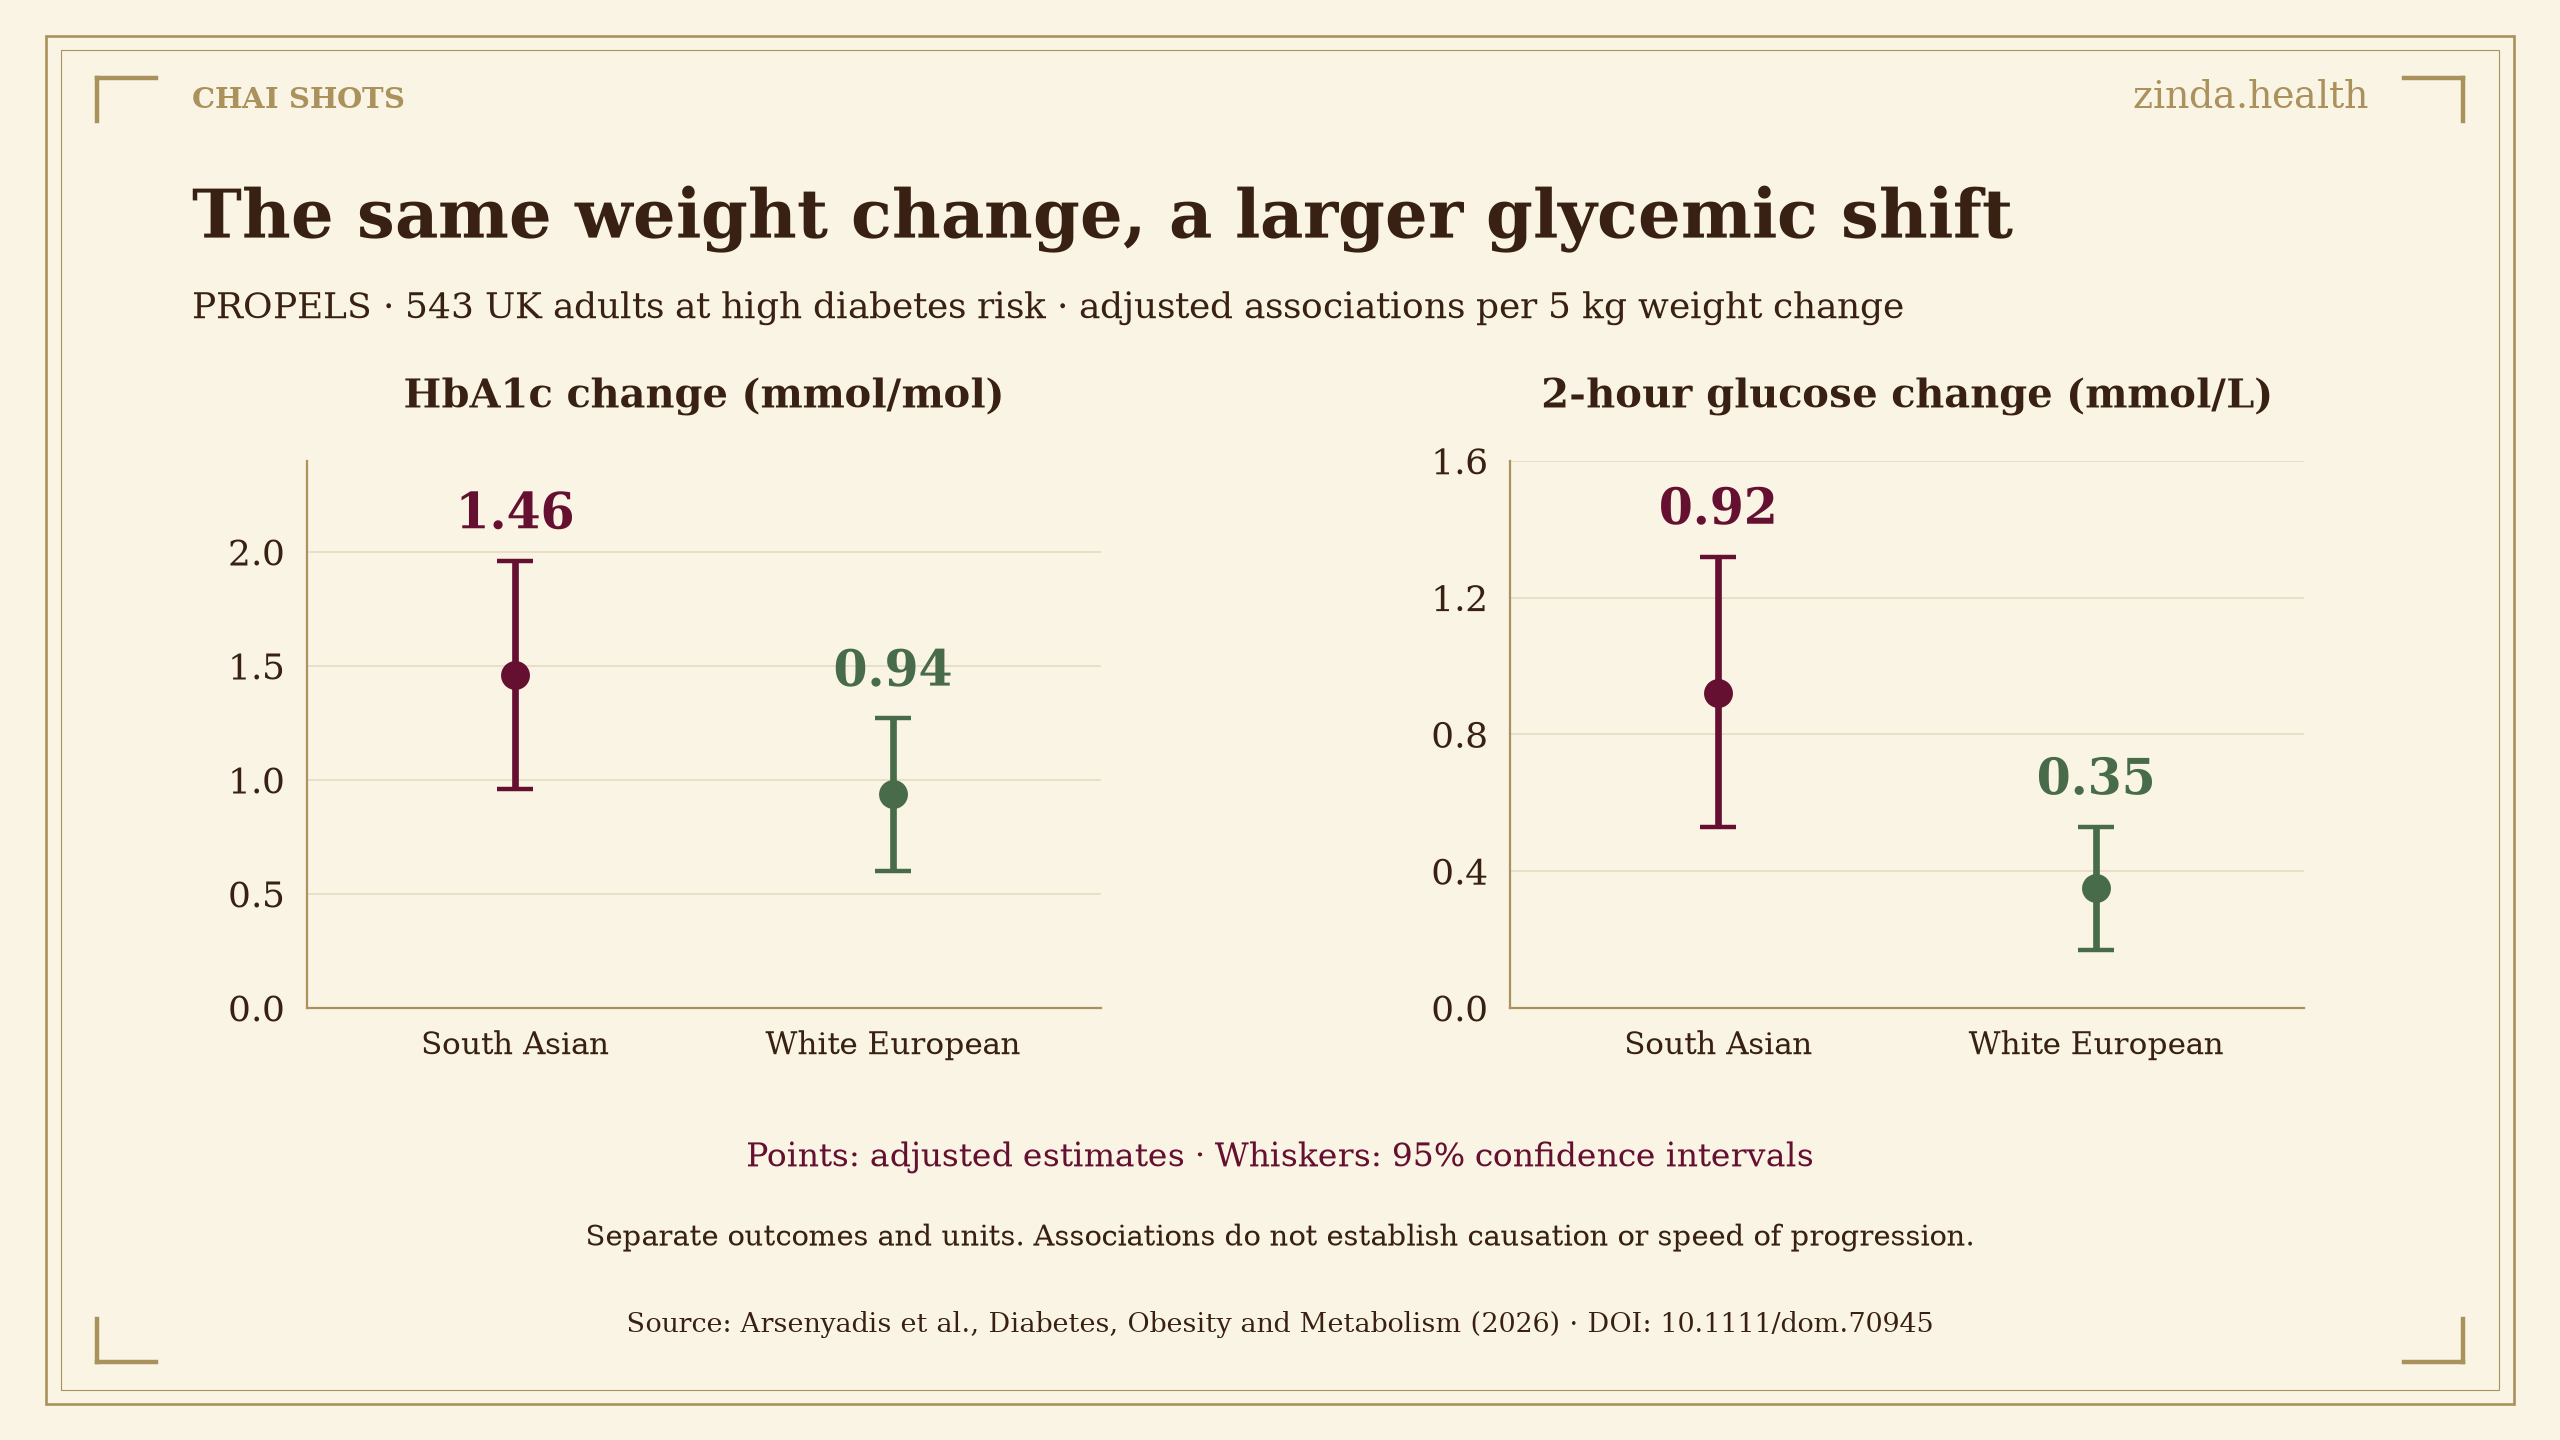
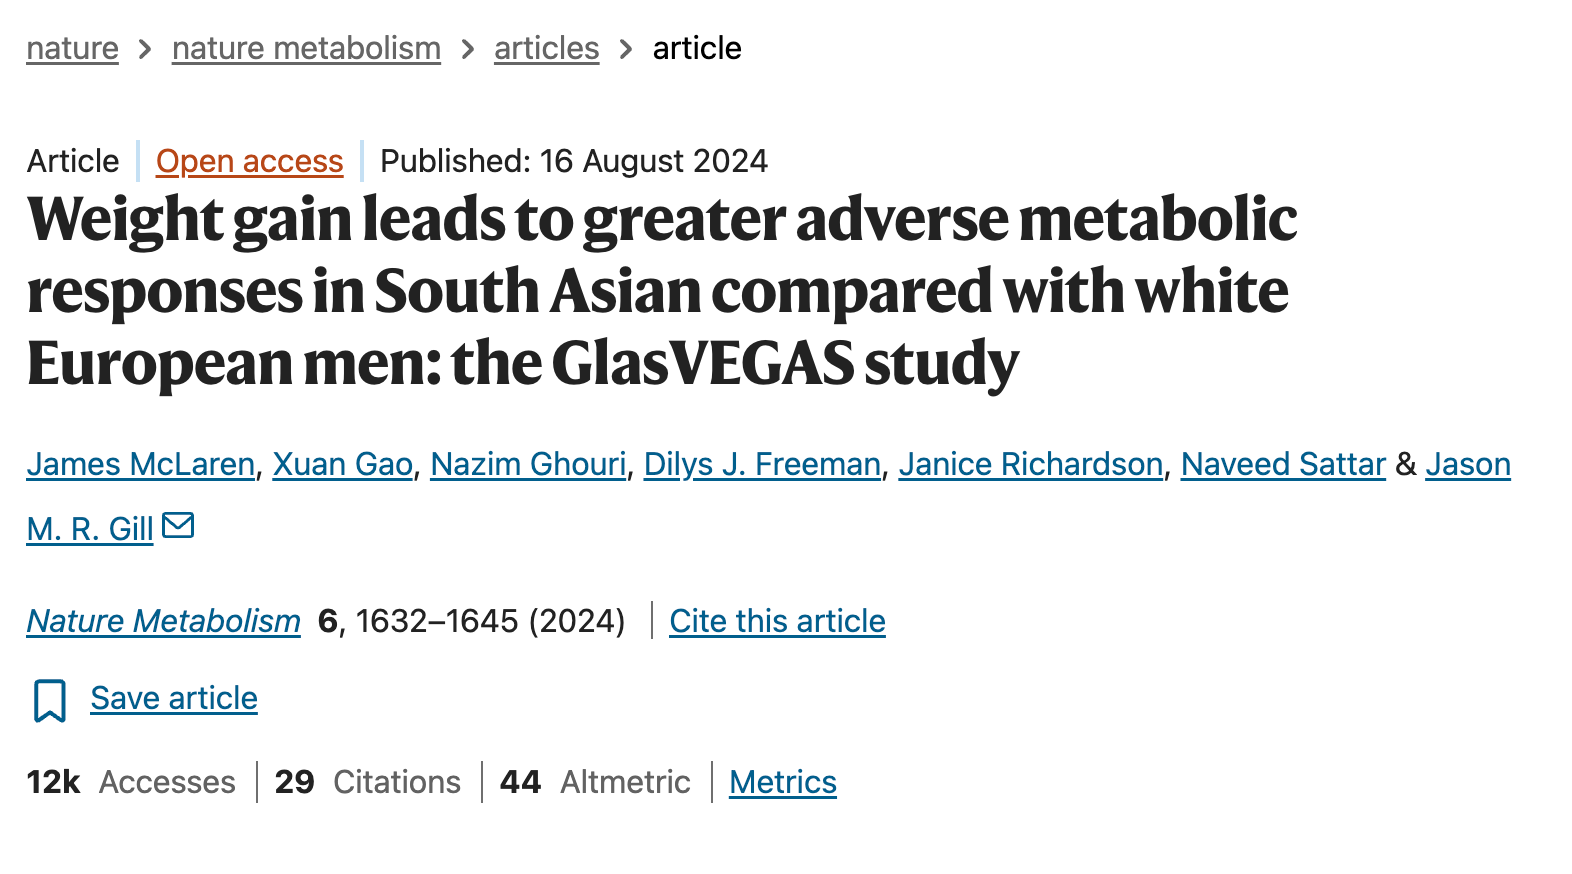
The GlasVEGAS experimental overfeeding study conducted earlier this year with lean men also found similar results, when body weight was increased by 5-7%, insulin sensitivity (Matsuda Index) decreased much more significantly in SA men as compared to White men (~38% vs. ~7%, respectively), without significant changes in fasting glucose in either group.
And lastly, Jagannathan, Narayan, Mohan and colleagues published the results of their CARRS cohort-based cluster/subtype analysis in Diabetes Care.
The analysis of data from 14,036 adults in Chennai, Delhi and Karachi with a median follow up duration of 10.6 yrs (during which there were 1076 deaths) found that of the 2639 with T2D, 77.5% belonged to the two insulin deficient clusters (23% belonged to the SAD, Severe Insulin Deficient cluster and 54.5% to the MID, mild Insulin Deficient cluster), with the remaining 22.5% in the SIR (Severe Insulin Resistant) cluster.
SAD-T2D had the highest mortality risk (HR for all cause mortality was 3.34 in the fully adjusted model) as well as the highest DALYs (Excess YLS, a component of DALYs, was 17.7 for SAD; as compared to 12.8 and 12.0 for MID and SIR respectively).
Of the 4992 participants who had prediabetes, two-thirds were classified in the insulin-deficient cluster, which was associated with significantly higher all cause as well as CVD mortality (insulin-resistant prediabetes was not associated with increased mortality).
(Note to my reader in Toronto, before you freak out, read the methods section to see how your geography/cohort differs from these!)
I plan to spend next month’s Chai Shots discussing what we can infer from all of these papers and how we can use this information in practice.
Chai Shot: Fragile Engine, The Metabolic Fragility Hypothesis
It may be the Fragile Engine, once CHARISMA (Hitt et al., Diabetes Care) compensation wears out, it looks like the first part, high secretion at age 20 and a later group (with a normal first part) who are deficient.
The “Fragile Engine” Problem

Fair warning: this post has quite a bit about cars considering Lando’s F1 win last weekend.
That’s my best interpretation, but it could easily be wrong. You’d know for sure if you did a repeat CHARISMA in SA 10-15 years down the track and the disposition index was still flat.
So it is a hypothesis for now, I have the beginning and end and am assuming a middle.
If it is the Fragile engine though, stage 2 is detectable well ahead of 3, it doesn’t need A1c yet (see below), it can be looked for with liver fat and glucose levels after challenge.
The Zinda Reading
CHARISMA is 4.1% and Stage 2 (high compensation, flat D/I, fat is spilling into the organs though) and Delhi is where the fat is spilling (at a pinned BMI, see graph, with the HOMA-b going up and then down) just before Dx. GlasVEGAS is the experimental one, it is a hit though.
I think FE is a reasonable interpretation of CHARISMA, the arginine clamp suggested there was no difference in maximum, so the SA engine just has to work harder (FE) not that it is bigger to get the same results.
Delhi (Ghosh, Misra and colleagues at the All India Institute of Medical Sciences) shows SA have more fat in organs at the same BMI. Delhi is better for FE as they pinned BMI at 25 (and have an MRI picture series to go with the graphs!)
The Leicester (PROPELS, Arsenyadis & Yates) one is SA doing worse in UK vs WE UK (nice control as they are in the same system) but after 4 years (slope). This and GlasVEGAS are Stage 2.5ish, they have escaped with normal fasting but are looking dodgy after glucose challenge.
The Chennai (CARRS, Jagannathan, Narayan, Mohan and colleagues) one is definitely stage 3 but has mortality, and over 10 years (in 14,036 people!)
All are well done studies. CHARISMA’s strength is it was well designed but its weakness is also that, the SAs were selected to be living in America and to have increased BMIs so 4.1% is definitely no way to get a SA normal figure.
Also the P’s for significance with African Americans were not always there, sensitivity difference was not sig, imCL was the same, the 31% with dysglycaemia was not significantly (P=0.49) higher.
Authors reported that not one SA had VF low enough to overlap with AA/WE and therefore controlling for VF was comparing their SA’s VF to an extrapolated line, not to real AA/WE values.
They use the phrase “adjusted for visceral fat”, and that may be doing heavy lifting, “may” being the important word.
What This Doesn’t Tell Us
It is interesting to me that the Adiponectin Deficit and the inflammatory surge (check out Signal Fire) seem to come on before all this action (unless of course the AD is down as a result of all this ectopic fat storage!).
The FE says SA store fat in their organs at the same BMI more readily (Yajnik’s “thin-fat” phenotype) and when their beta cells struggle in response, they don’t last as long as other ethnic groups.
CHARISMA tells us SA beta cells are already working flat out by 20, GlasVEGAS & PROPELS studies show glucose control starts slipping after 4 years (and why the normal A1c doesn’t give a free pass, you do need the 1 & 2 hour values!) and Delhi and Chennai tell us what happens to beta cells around Dx (and SA die earlier after Dx).
What they all do NOT tell us is whether SA coming here make any difference. It looks like not. That’s been the story so far anyway.
All this social stuff of earlier/later Dx, better/worse treatment & follow up that I said transfers poorly across the ocean (leading to the 18 lost years)? Physiologic subtypes seem to transfer pretty well.
In fact often time SA do worse here, Delhi & CARRS breathe different air, live with different foods & health care to Houston or Hounslow.
We thought exposure to the west was usually better for SA (the reverse of the usual healthy migrant effect) and for other health things this is true.
For diabetes though, it doesn’t look like SA get as sick here any less often. That fits FE, I imagine the surroundings changing but the layers being pretty constant.
Where Zinda Fits
These four papers are now filed in the Evidence Library as full study dossiers under the Fragile Engine and the Overflow Tank, each linked to the stage it fills. The N=1 Case Repository holds more than 7,300 case reports and case series across eighteen clinical domains, the long tail a single trial will never capture, including the versions of this sequence that don’t follow the textbook order. The Gene Atlas and the clinical framework keep growing around the same question: where does a guideline-normal number become false reassurance?
None of that is a substitute for trials. A framework is not a guideline, and a case report is not a cohort. What these resources can do is keep the sequence visible; liver fat before A1c, secretory work before fasting glucose, insulin-deficient death after years of looking “not that overweight” — so the next calculator, and the next guideline, inherits less of the blind spot. That is the larger project behind Zinda Futures.
For you, the reader, translation is quite simple.
If you are South Asian and the fasting glucose looks fine, the useful questions are about work and placement:
Ask whether anyone has looked at a post-challenge glucose; one hour and two hours, not only fasting.
Ask about liver fat if the enzymes or the waist already look off.
Ask what the fasting insulin is, knowing it under-reads this phenotype. A high one tells you something. A normal one settles less than it appears to.
Earlier labs are not earlier procedures. The treatment bar should stay high. But the sequence this summer traced; the spill, the compensation, the cost, the failure, is visible years before the diagnosis, if anyone looks in the right order.
Keep the questions sharp and the chai warm.
— Omar
Zinda Health is a reader-supported publication. To receive new posts and support this work, consider becoming a free or paid subscriber.
Sources: Hitt TA et al. “Insulin Hypersecretion and Increased Ectopic Fat in South Asian American Adolescents and Young Adults Compared With White and African American Peers: The CHARISMA Study.” Diabetes Care, 2026. Ghosh et al. “Hepatic, pancreatic and abdominal fat depots in BMI-matched Asian Indians across glycaemic categories.” Diabetologia, 2026. Arsenyadis, Yates et al. PROPELS secondary analysis. Diabetes Obes Metab, 2026. Jagannathan et al. CARRS subtypes. Diabetes Care, 2026. “Prevalence of metabolic dysfunction associated steatotic liver disease in type 2 diabetes mellitus in India: a systematic review and meta-analysis.” Indian J Med Res, 2026. “Development of age-specific and sex-specific blood pressure norms and their associations with lipids” (Bengaluru). BMJ Paediatr Open, 2026. McLaren et al. GlasVEGAS. Nat Metab, 2024.